Your portfolio in KANAP in ten minutes
Explore with the example · Start with my own data
Fromage & Co is a fictional cheese group whose example is loaded in your workspace. In ten minutes on its portfolio, you read how a request is scored, follow it into a project, find the tasks, read the reports and see how your own file comes in.
These are the five steps of the Your first five steps tile on the home page, for the path Projects and requests with Explore with the complete example. Each step in the tile opens its screen with a short hint, and opening it marks it done. See Trial: your path and first steps.
1. A request and its score
The best-scored request, opened by the step on its Scoring tab
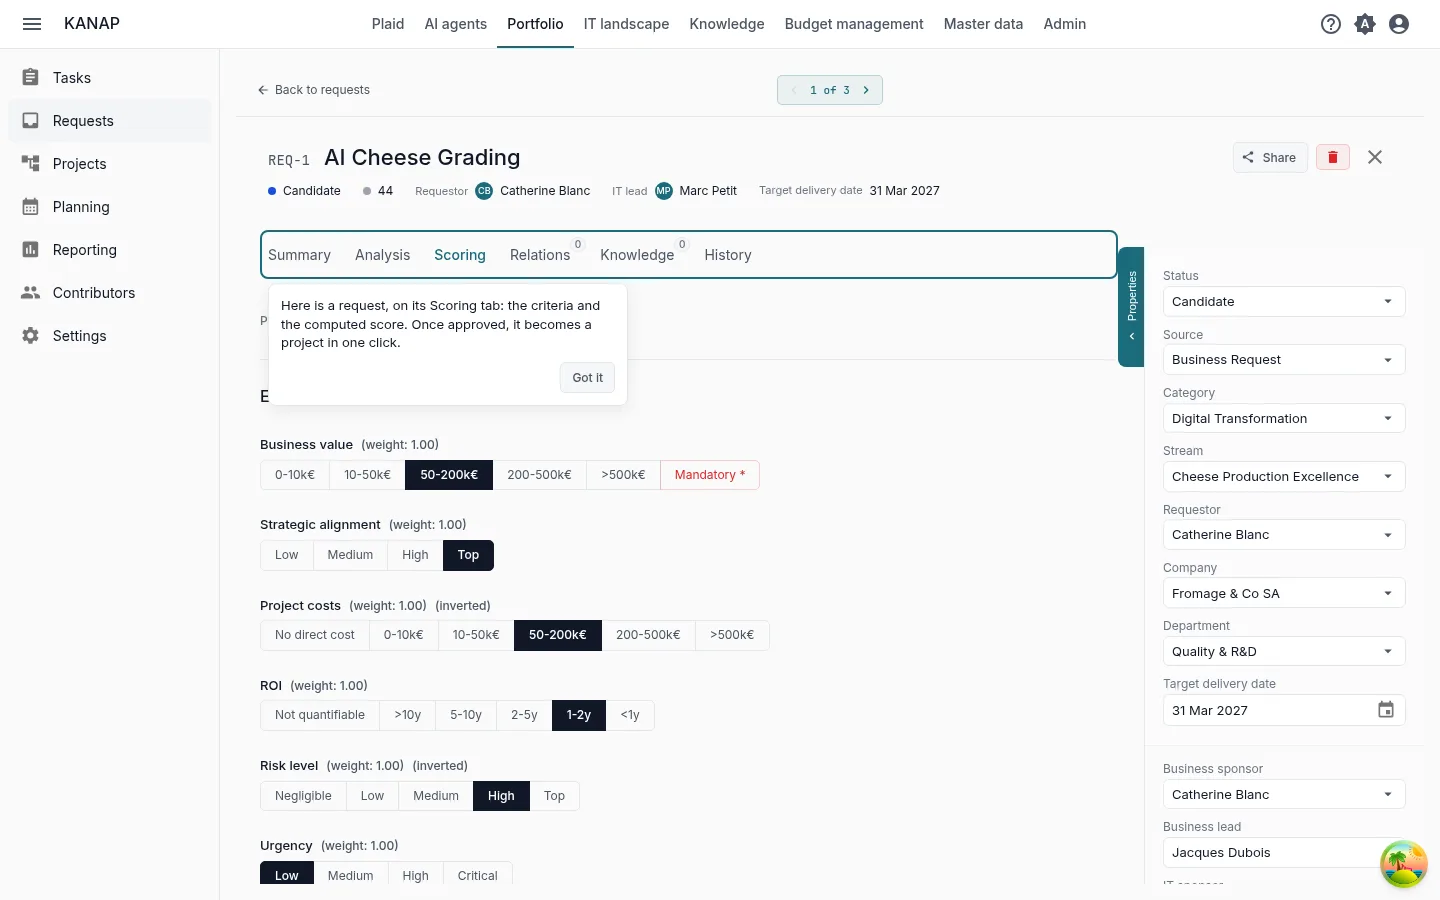
What to do. Read the answer to each criterion and the score they give.
What you see. A request is a project not yet decided. KANAP scores every request on the same criteria, so the decision compares like with like. The criteria and their weights are set once in Portfolio > Settings, Scoring criteria tab. Once Approved, a request becomes a project with Convert to project.
2. The project born from the request
The project of a converted request, opened by the step
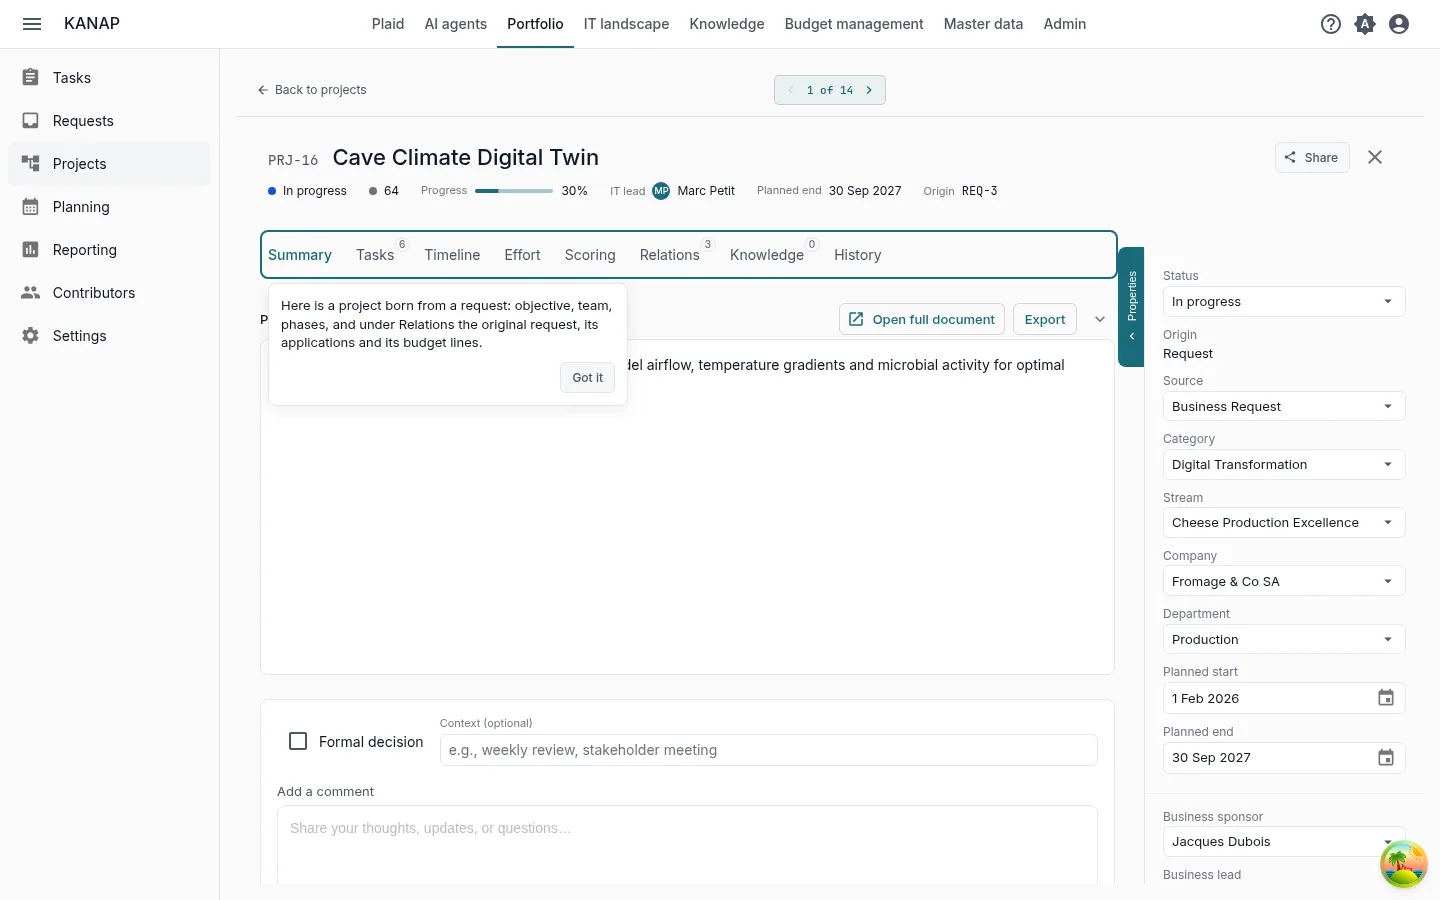
What to do. Read the properties panel, then open the Timeline, Effort and Relations tabs.
What you see. The properties panel gives the owners and the project team. Timeline places the phases. Effort sets the progress against the effort planned and consumed. Relations shows the request the project comes from, its applications and its budget lines.
3. Tasks
Portfolio > Tasks
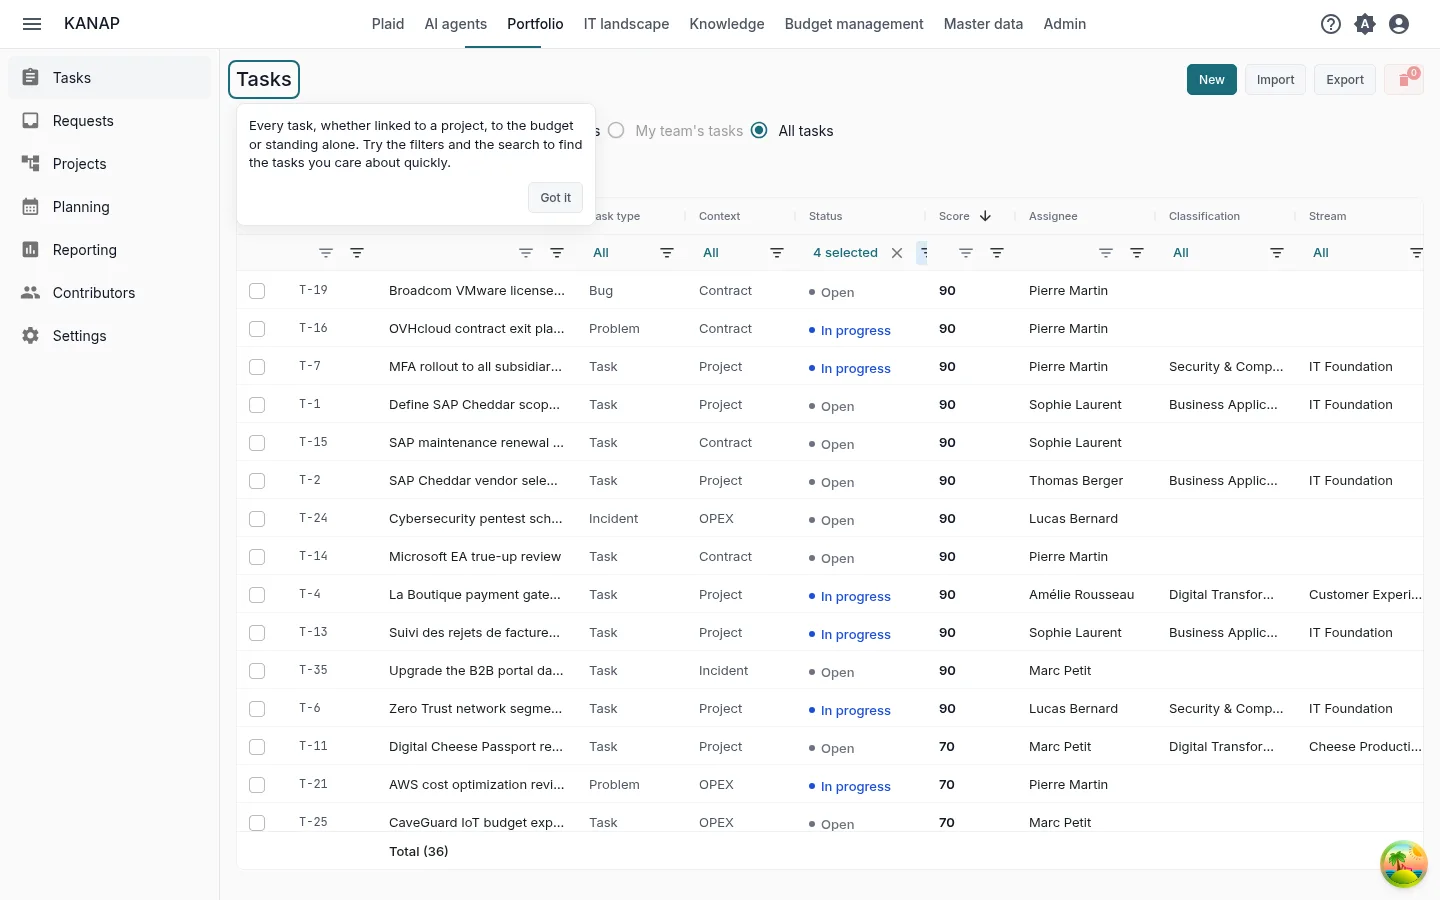
What to do. Try the filters and the search to find the tasks you care about.
What you see. Every task, whether it belongs to a project, to the budget or stands alone, with its status.
4. The reports
Portfolio > Reporting
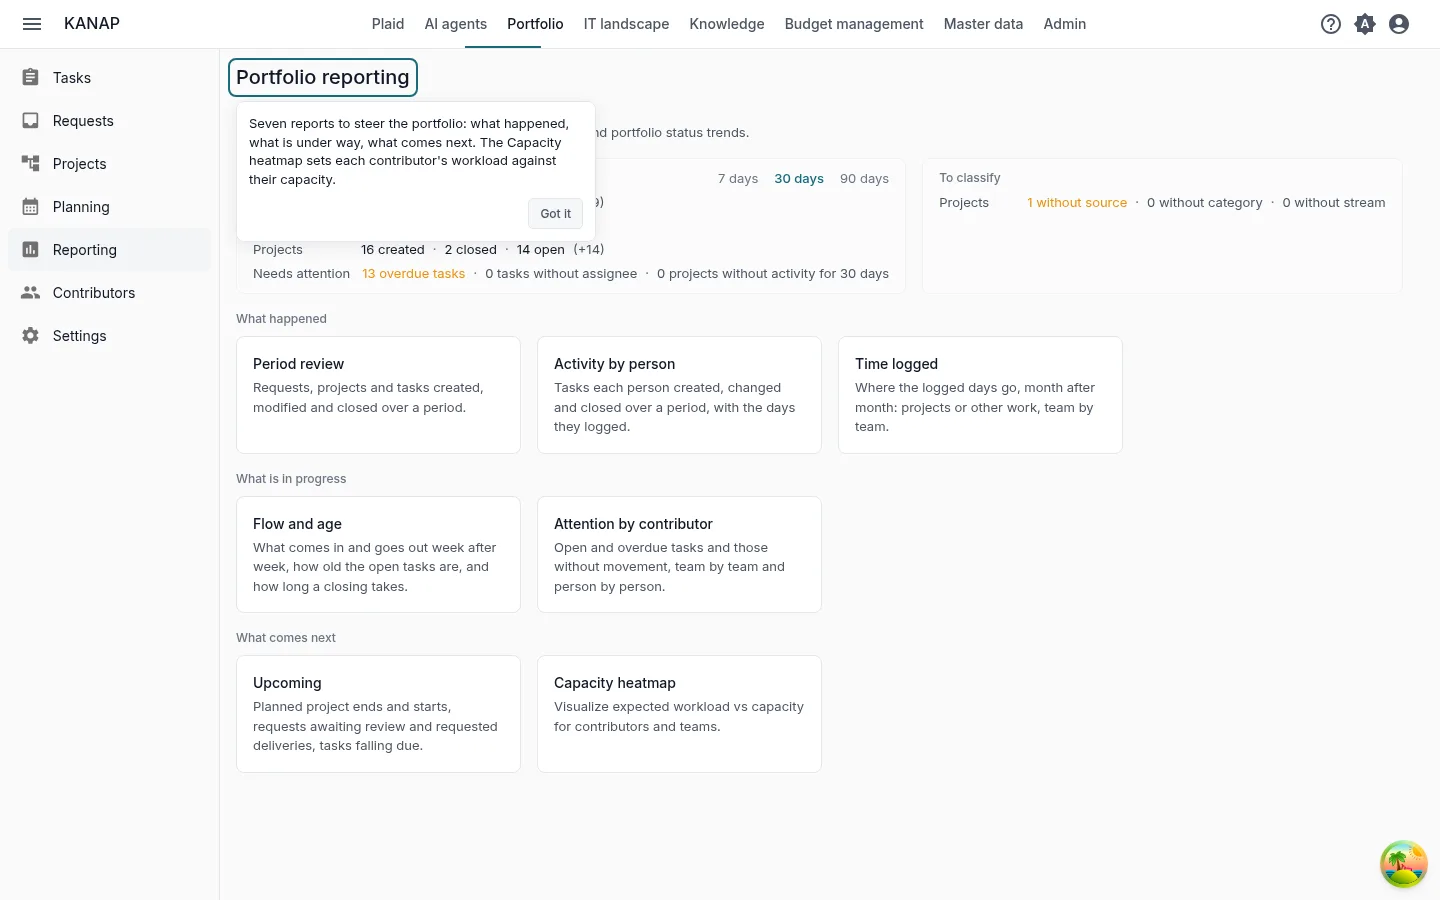
What to do. Open Capacity heatmap, then the other reports.
What you see. Seven reports to steer the portfolio: what happened, what is under way, what comes next. Capacity heatmap sets each contributor's workload against their capacity.
5. Your data
Portfolio > Projects, Export
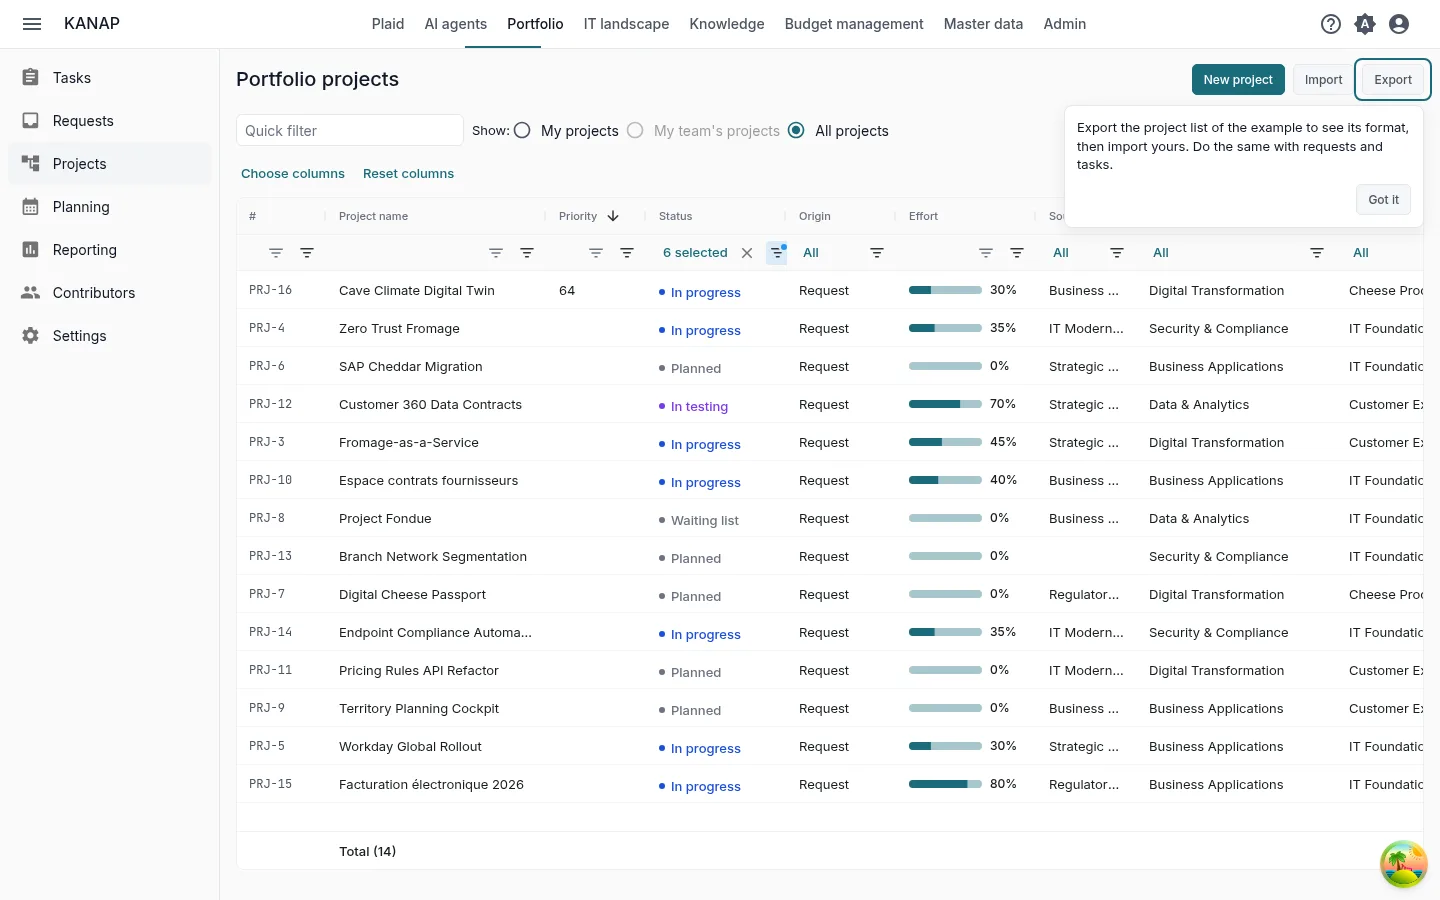
What to do. Click Export, choose CSV or Excel (.xlsx) and open the file. Then click Import and Download an example.
What you see. The export titles its columns in your language and the import reads the same columns: use it as a template for your own projects. The example workbook holds a few projects, the other columns on an Advanced sheet and what each column takes on a Notes sheet. Requests and tasks have their own Export and Import. These buttons are shown to the administrators of the list.
To start from a file you already keep, attach it to a message in Plaid with Attach a file. Plaid reads its column headers, the type of each column and the first ten rows, and can say what each column holds.
Next
You have seen the essentials of KANAP for projects and requests. The two other paths also take ten minutes:
When the five steps are done, the tile offers these paths. During the trial, it also offers Book a discovery call.
To go further: Requests, Projects, Tasks, Portfolio reporting, CSV and Excel files.